

Data-led stories on the world economy
We look at countries and markets in the news, put the numbers side by side with history, and explain what is really going on: growth, debt, currencies, trade and the policy choices behind them.
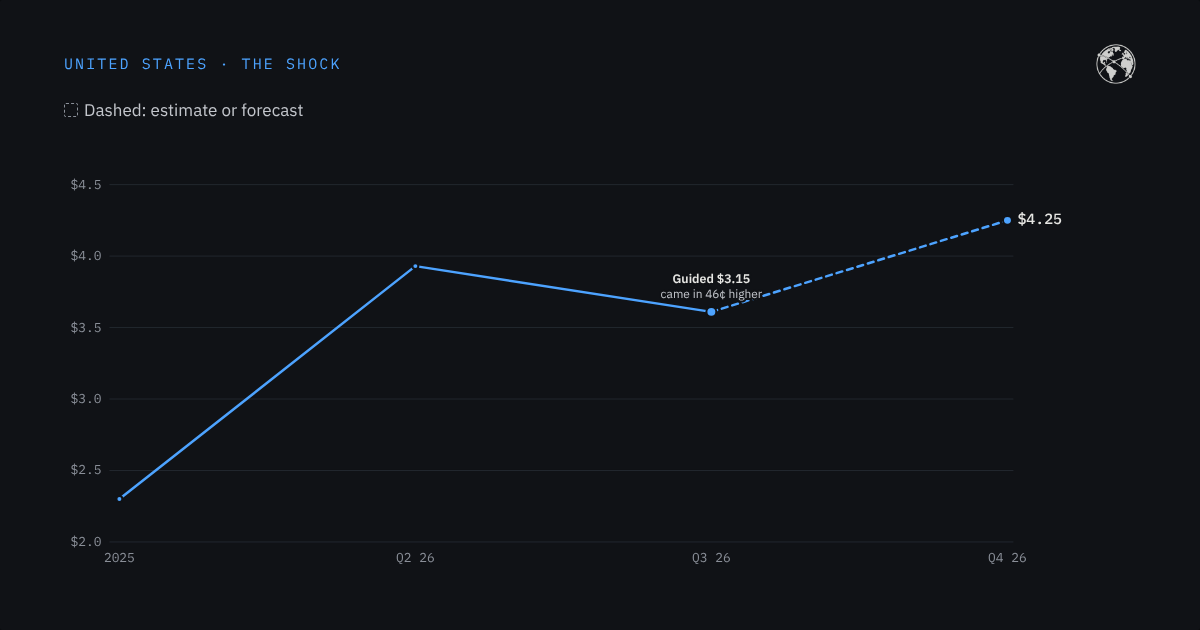
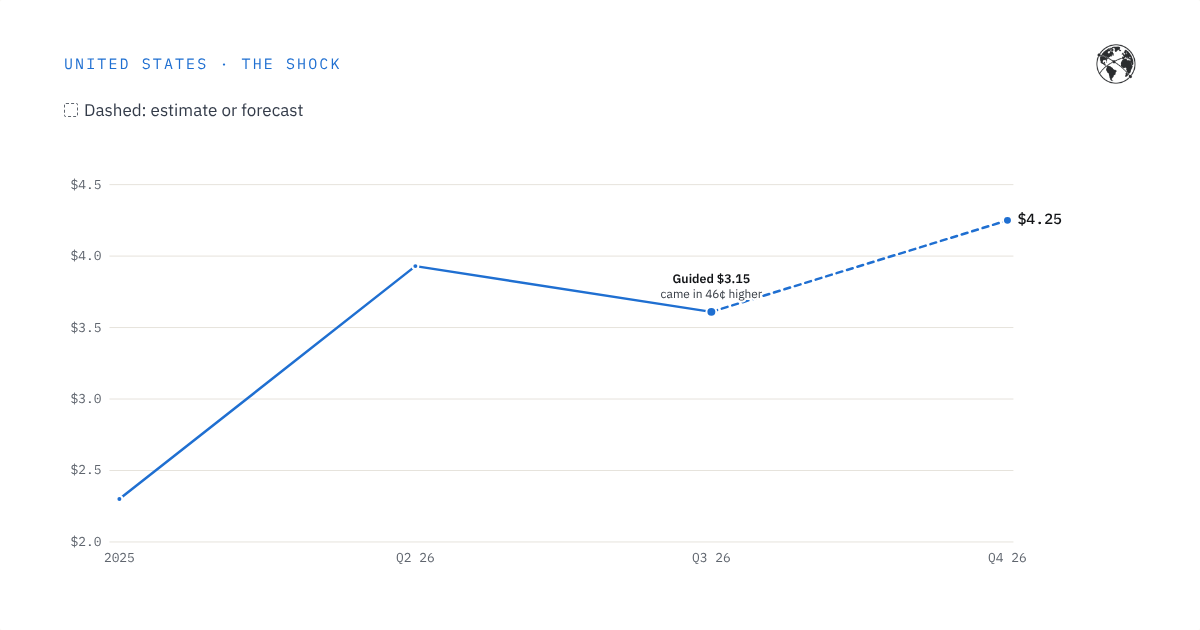
Delta is quietly an oil company, and that is how it is surviving $100 oil
Fuel cost Delta $1.6 billion more last quarter than a year earlier, yet its pre-tax profit did not fall. The airline that owns a refinery and earns $9 billion a year from a credit card is built differently from its rivals.
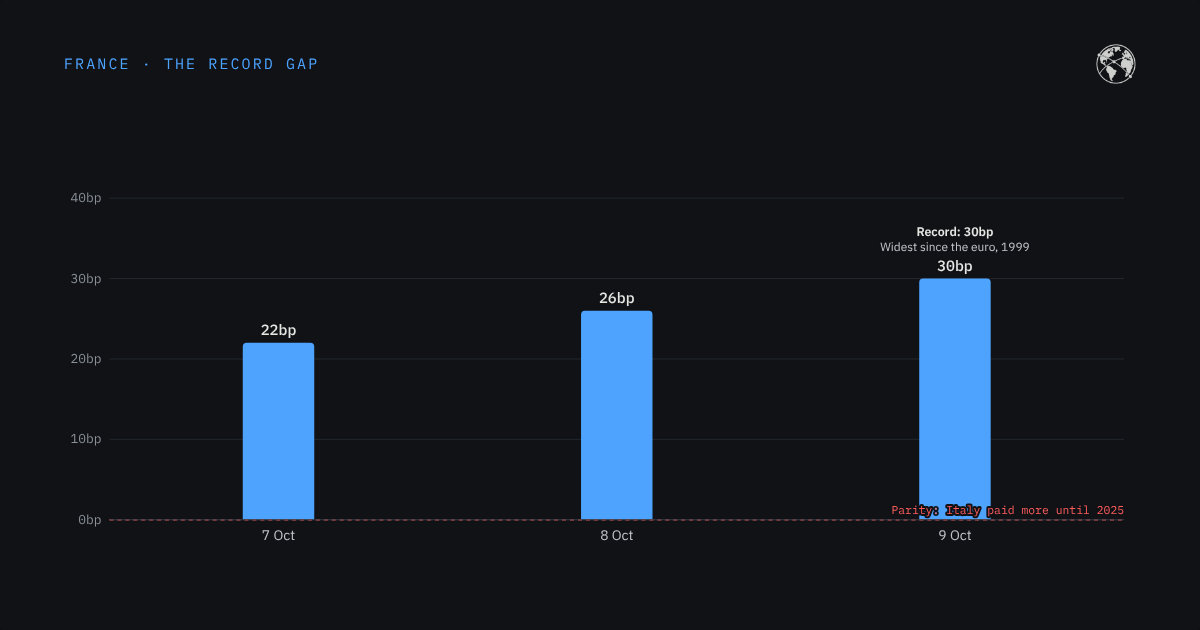
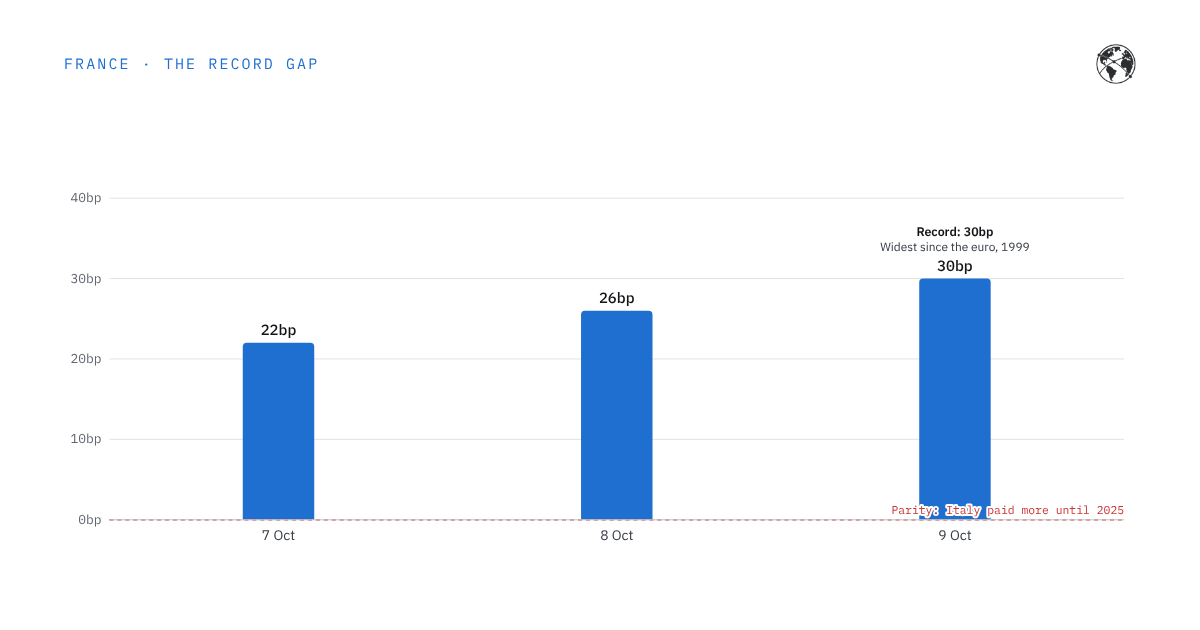
France pays more than Italy to borrow, by the widest gap in euro history
Markets now charge France more than Italy by the largest margin since 1999. The 2027 budget explains why: a 5% deficit, debt still rising and a record €340bn of bonds to sell.
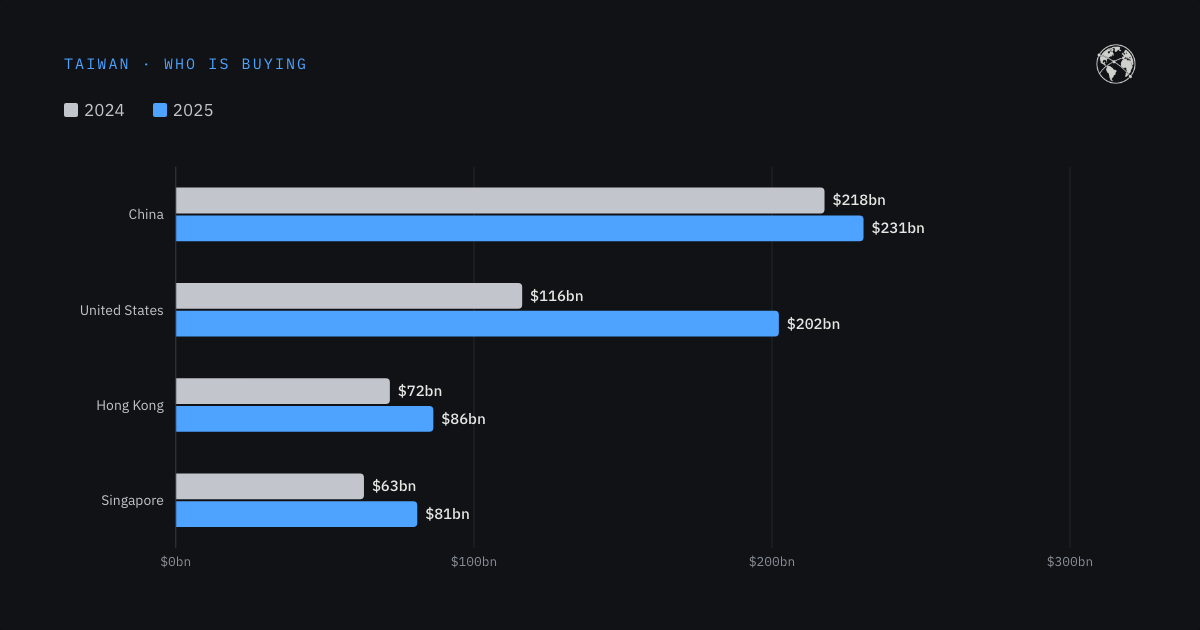
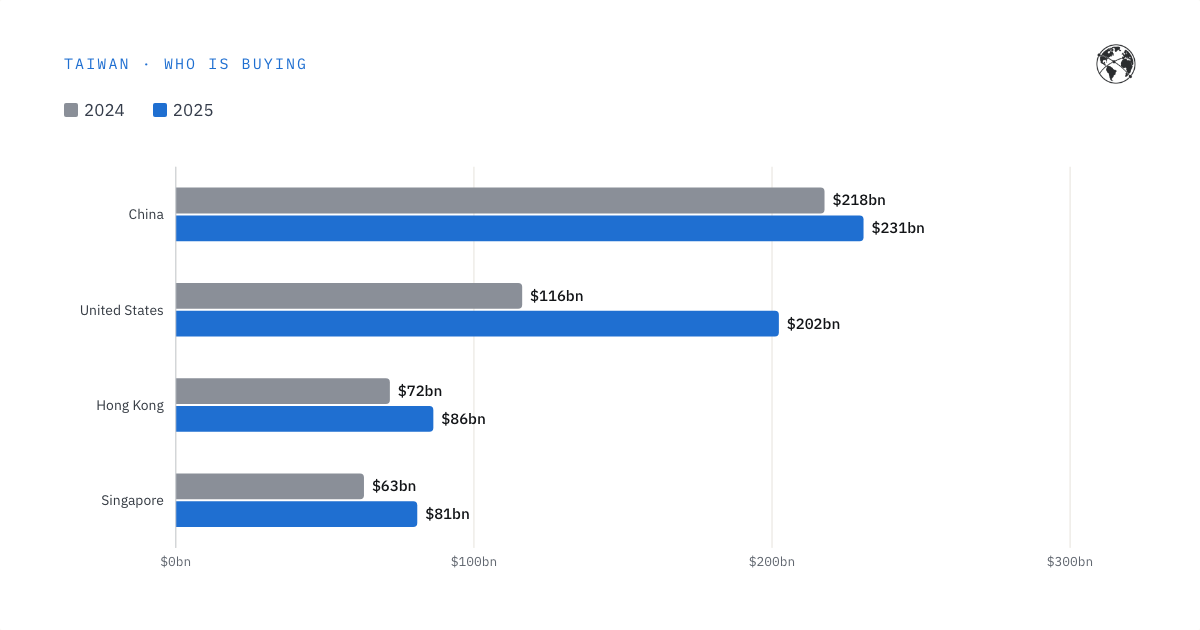
Taiwan is growing at 13%. Finland and the Netherlands know how this can end
One island supplies the chips and servers behind the AI build-out. The boom is real. So is the history of small economies that became essential for one thing.
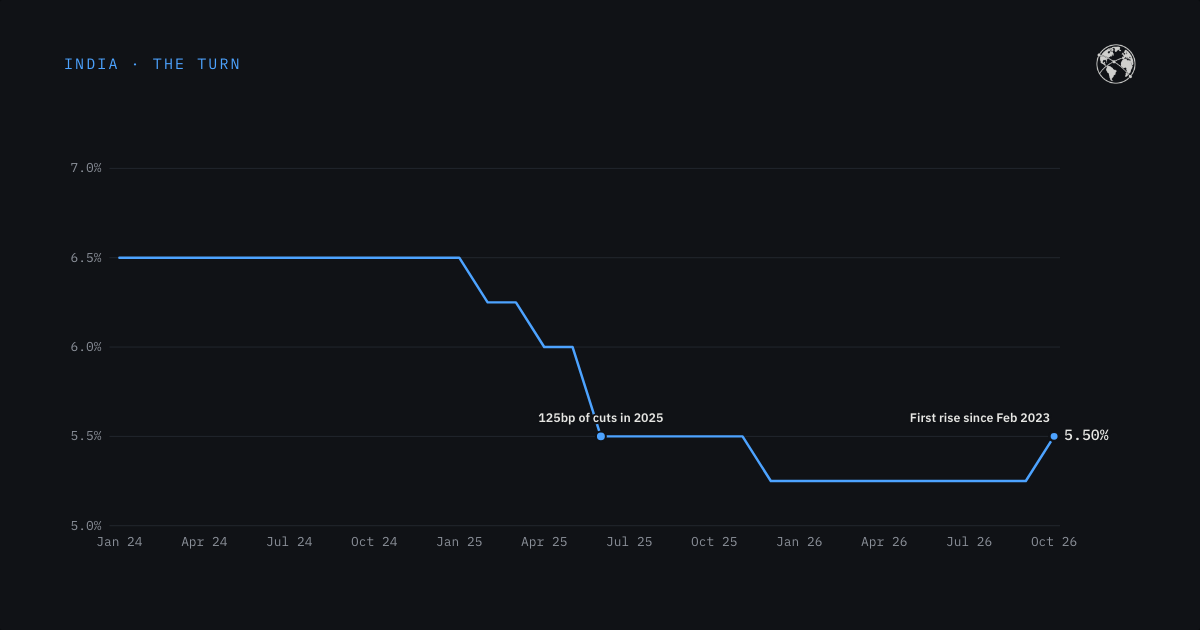
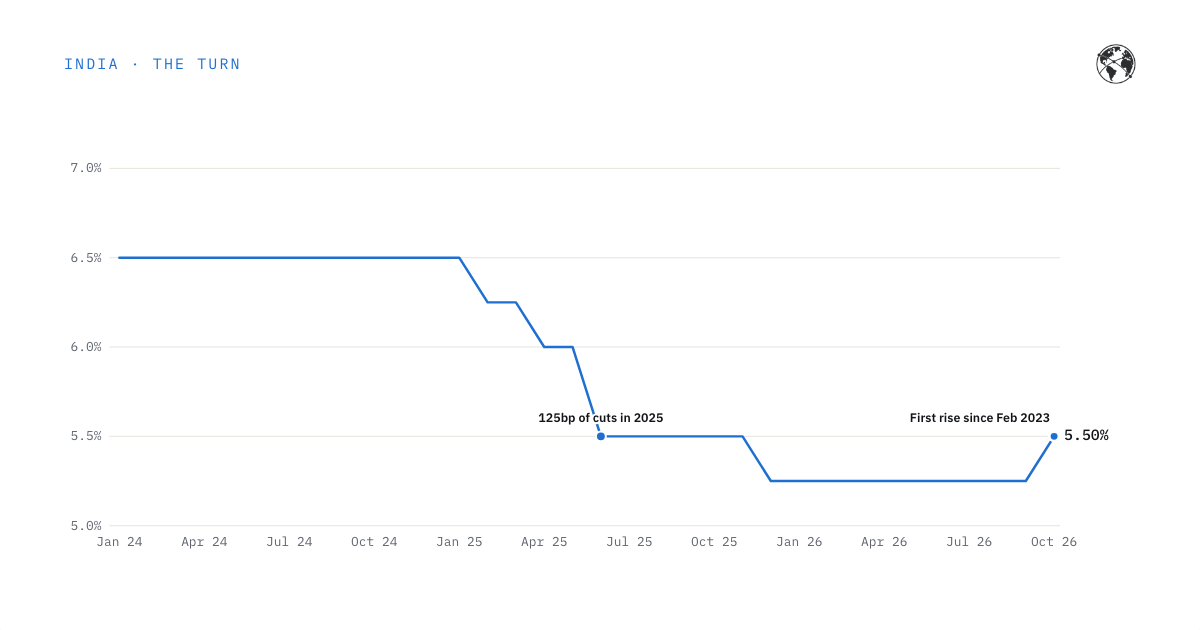
India raised rates with core inflation at 2.9%. Oil did this, not a boom
The Reserve Bank of India has made its first rate rise since February 2023. Headline inflation is climbing and the rupee is near 96.5 to the dollar. Core inflation, excluding gold and silver, is just 2.9%. That points to an imported shock, not a boom, and to a short tightening cycle.
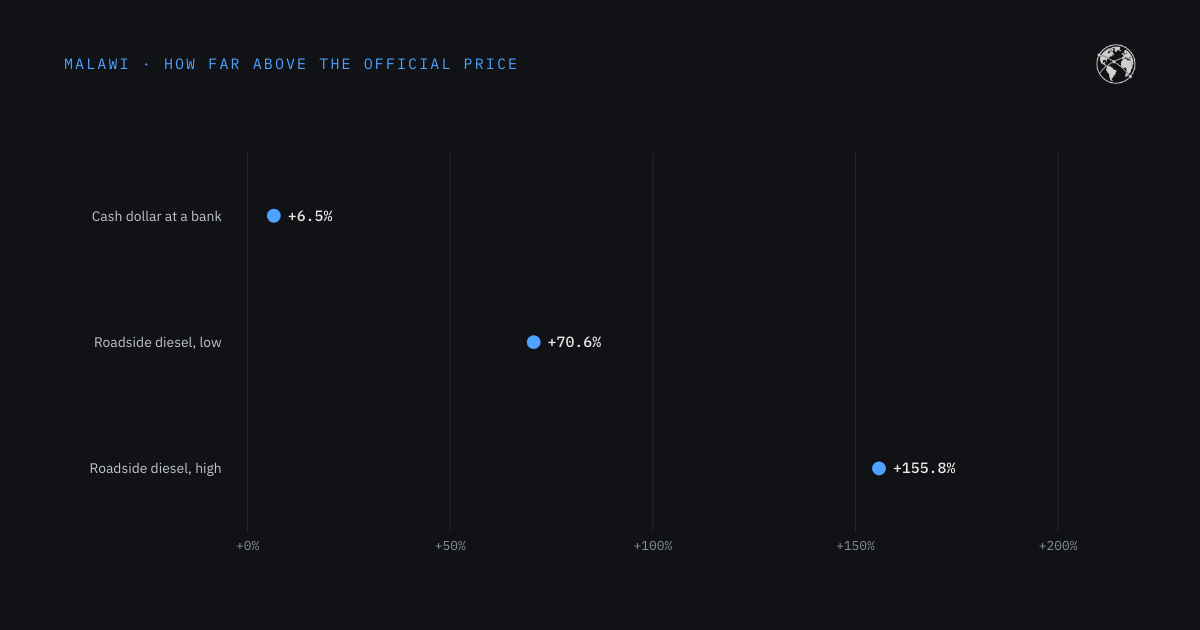
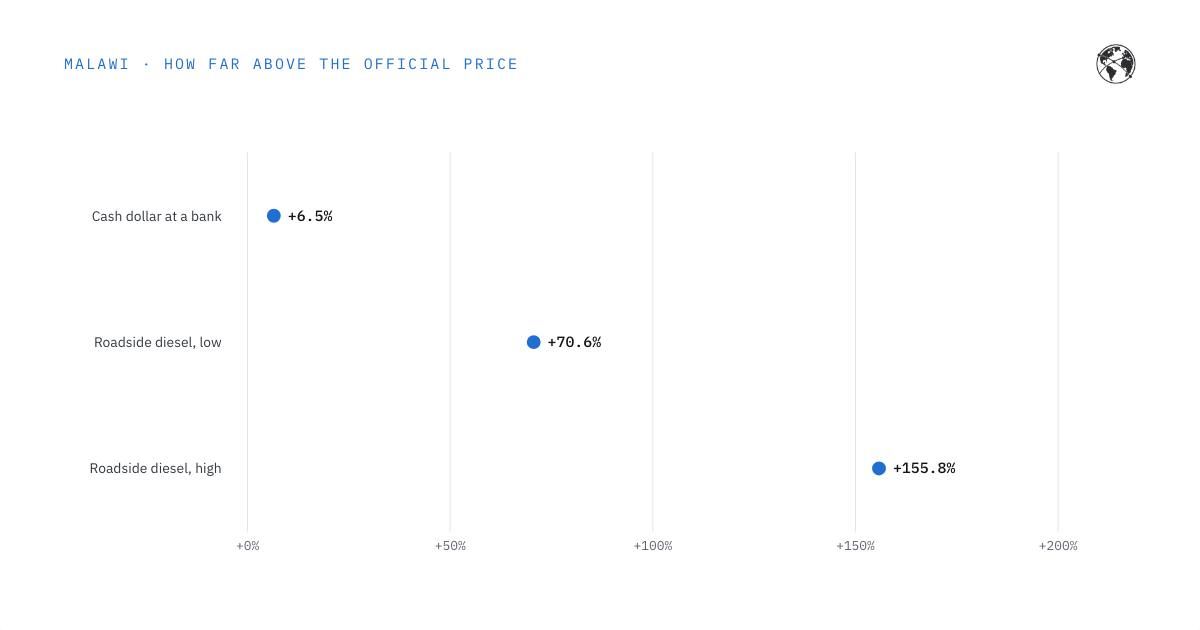
Malawi's dollar costs K1,751 on paper, but the IMF deal needs a real price
Lilongwe says devaluation is not on the table. The IMF says talks continue. Both past IMF programmes came only after the kwacha was cut, and the gap between the official rate and the real price of a dollar is still there.
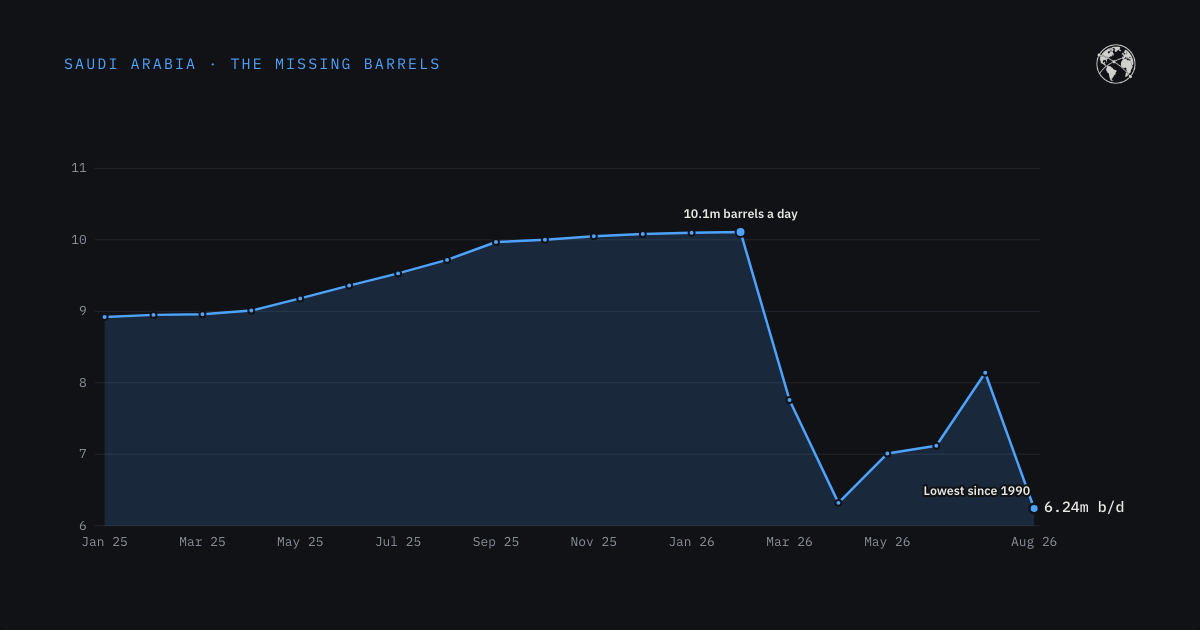
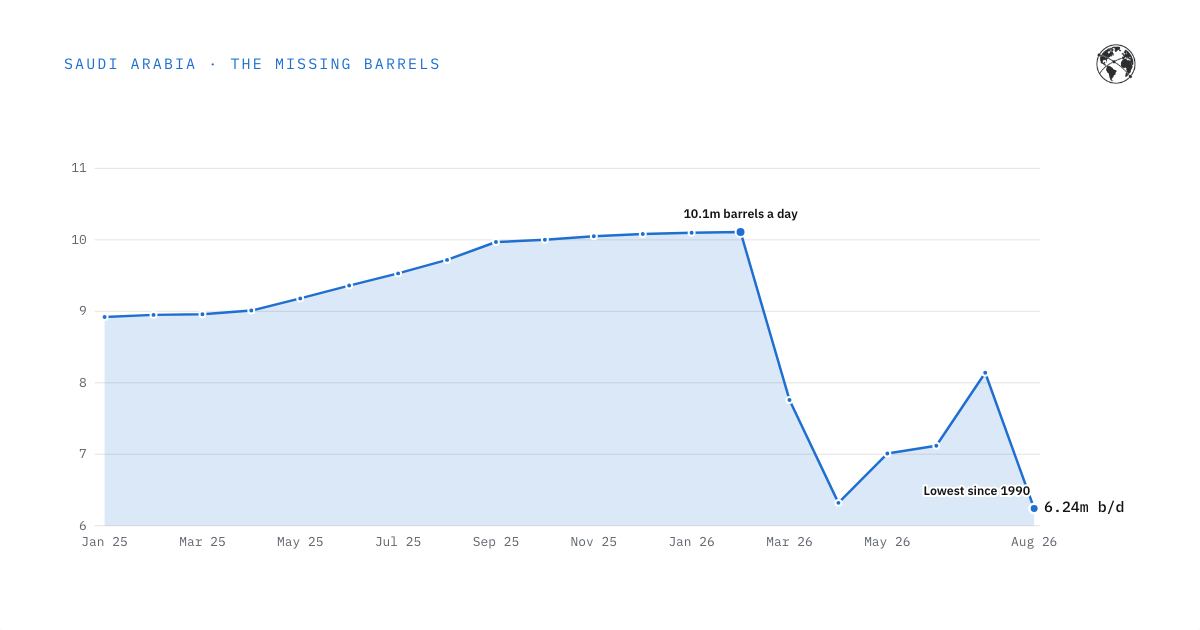
Oil is near $100, and Saudi Arabia's economy is shrinking anyway
High prices do not help when you cannot ship the barrels. War in the Gulf and drone strikes on the East-West pipeline cut Saudi output to its lowest since 1990, and the deficit is now far bigger than planned.
Senegal's oil boom and its debt crisis are the same story
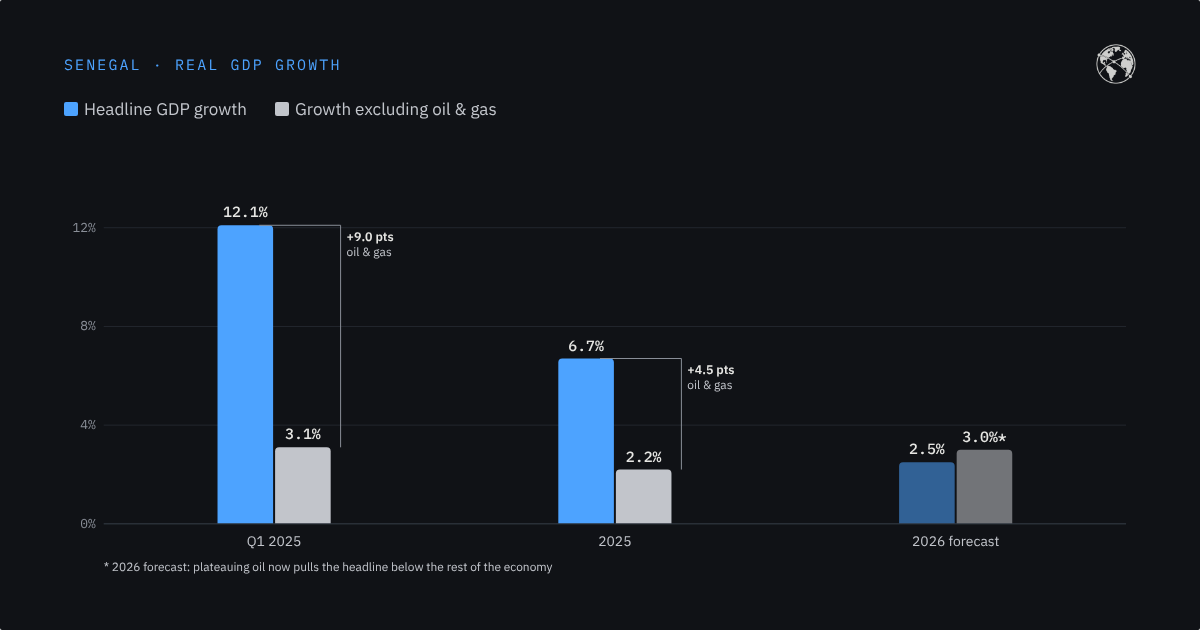
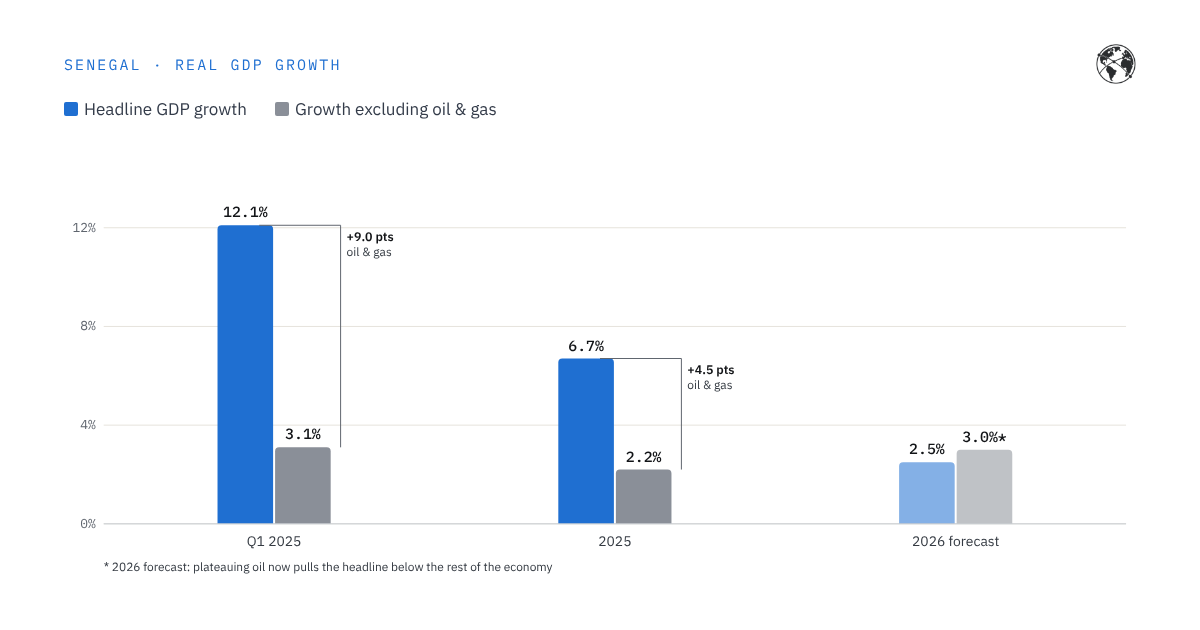
Growth hit 6.7% the year Senegal's oil started flowing. This week its creditors were on a call about restructuring. Here's how both can be true, and why Ghana and Zambia saw it coming.